
GRAPH SHOWING MOVING AVERAGE FOR THE 7 DAY PRECEDING AVERAGE.
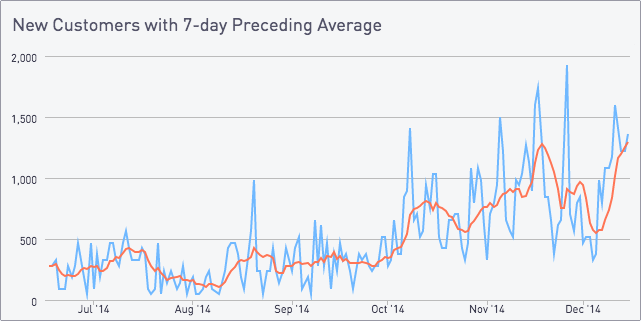
With a 7-day preceding average line like this:
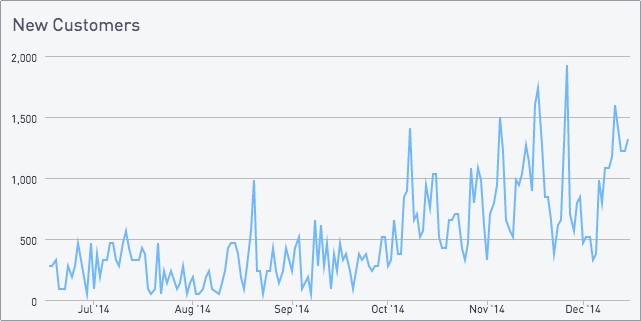
The Big Idea
Our first graph above is pretty noisy and hard to get useful information from. We can smooth it out by plotting a 7-day average on top of the underlying data. This can be done with window functions, self-joins, or correlated subqueries - we’ll cover the first two.
We’ll start with a preceding average, which means that the average point on the 7th of the month is the average of the first seven days.
Visually this shifts the spikes in the graph to the right, as a big spike is averaged over the following seven days.
First, Create an Intermediate Count Table
We want to compute an average over the total signups for each day. Assuming we have a typical users table with a row per new user and a timestamp created_at, we can create our aggregate our signups table like so:
select
created_at::date as date,
count(1) as value
from new_customers
group by 1
In Postgres and SQL Server you can use this as a CTE. In MySQL you can save it as a temporary table.
Postgres Rolling Average
Fortunately Postgres has window functions which are the simplest way to compute a running average.
select
date,
value,
avg(value)
over (order by date asc
rows between 6 preceding and current row) as avg,
from signups
order by 1 desc
This query assumes that the dates do not have gaps. The query is averaging over the past seven rows, not the past seven dates. If your data has gaps, fill them in with generate_series or joining against a table with dense date rows.
MySQL Rolling Average
MySQL lacks window functions, but we can do a similar computation using self-joins. For each row in our count table, we join every row that was within the past seven days and take the average.
select signups.date, signups.count, avg(signups_past.count)
from signups
join signups as signups_past
on signups_past.date between signups.date - 6 and signups.date
group by 1, 2
This query automatically handles date gaps, as we are looking at rows within a date range rather than the preceding N rows.
SQL Server Rolling Average
SQL Server has window functions, so computing the rolling average can be done in either the Postgres style or MySQL style. For simplicity, we’re using the MySQL version with a self join.
This is conceptually the same as in MySQL. The only translations are the dateadd function and explicitly named group by columns.
select signups.date, signups.count, avg(signups_past.count)
from signups
join signups as signups_past
on signups_past.date
between dateadd(day, -6, signups.date) and signups.date
group by signups.date, signups.count
Other Averages
We focused on the 7-day trailing average in this post. If we wanted to look at the 7-day leading average, it’s as simple as sorting the dates in the other direction. If we wanted to look at a centered average, we’d use:
No comments:
Post a Comment